Against best practices during our Cool Zone era, I'm going to make a firm prediction about what is going to happen to the stock market in 2025:
In 2025 we will see a sharp sell off of stocks in
March. The stock market will hobble
along through the spring and summer with a full reckoning with the many
tentacled tech bubble 2.0 in the fall (probably October, maybe September).
As market predictions go, this is pretty precise. What
gives me the confidence to issue such a detailed prophesy like I'm fuckin'
Muad'dib over here? A reasonable grasp of the financial history of the
US. The US financial system is a bubble
machine and it produces bubbles with remarkable uniformity.
Let’s start with the crown jewel of American financial
disasters, the stock market crash of 1929. Here, I defer to the man who
wrote the book on it, John Kenneth Galbraith:
On Monday, March 25, the first
market day following the unseemly Saturday meeting [of the federal Reserve
Board], the tension became unbearable. Although, or rather, because Washington
was still silent, people began to sell. Speculative favorites--Commercial
Solvents, Wright Aero, American Railway--dropped 10 or 12 points or more,
the Times industrial average was off 9.5 points for the day
... On the next day, Tuesday, March 26, everything was much worse. The
Federal Reserve Board was still maintaining its by now demoralizing
silence. A wave of fear swept the market and amazing 8,246,740 shares
changed hasn on the New York Stock Exchange, far above any pervious
record. Prices seemed to drop vertically. At the low for the day
20- and 30- point loses were common place. The Times industrials
at one time were 15 points below the previous day's close. (The Great Crash of 1929, p35-36)
Galbraith goes on to describe an intervention in the form of reassuring words from Charles E. Mitchell. As head of the First National City Bank
(which later became Citibank) Mitchell offered to loan money as needed to
prevent more stock liquidations.
Mitchell soothed the animal spirits of the market enough for the bubble
to continue going through the spring and summer of 1929. Make a note of
this, it will come up again later: A financial panic in March, followed by an
intervention that keeps the system running through the spring and summer.
And then? Well, Galbraith is a better writer than I am
so I'll let him explain it. After signs of market weakness throughout
October 1929:
Thursday, October 24, is the first
of the days which---history such as it is on the subject---identifies with the
panic of 1929. Measured by disorder, fright, and confusion, it deserves
to be so regarded. That day 12,894,650 shares changes hands many of them
at prices which shattered the dreams and hopes of those who had owned
them. Of all the mysteries of the stock exchange there is none so
impenetrable as why there should be a buyer for everyone who seeks to
sell. October 24, 1929, showed that what is mysterious is not inevitable.
Often there were no buyers, and only after wide vertical declines could anyone
be induced to bid. (p99)
Anyway, I encourage you all to read Galbraith's
"The Great Crash" to get a more full sense of the future-past we are
about to stumble into. This pattern is remarkably close to the pattern of
financial crash in 1907. After the Bank of England took measures that
turned a gold inflow into the US into a gold outflow:
The effect showed up first in the
financial markets. Severe price declines occurred on the stock exchange
early in March 1907. Union Pacific stock, which had been extensively used
as collateral in finance bill operations, fell by 30 per cent within less than
two weeks. Despite every action taken by the Treasury, and a temporary
reversal in stock prices, the boom had come to an end, the National Bureau [of
Economic Research] dating the cycle peak in May 1907
...
The contraction is sharply divided
into two parts by the banking panic that occurred in October 1907. From
May to September, the contraction showed no obvious signs of severity.
Prices continued to rise; production in various lines flattened out but did not
decline seriously, and freight car loadings behaved similarly; bank clearings
held fairly stead, and there was no drastic rise in the liabilities of
commercial failures. The one significant change change was the reversal
noted earlier in gold movements from new imports to net exports. In
October came the banking panic, culminating in the restriction of payments by
the banking system, i.e., in a concerted refusal, as in 1983, by the banking
system to convert deposits into currency or specie at the request of
depositors. (Friedman
and Schwartz, Monetary History of the US, p156-157)
So what explains the similarity of the seasonal
pattern? I honestly don't have a clear understanding of why March panics
presage October collapses. The October collapses are easier to
explain. Here, I defer to Charles Kindleberger:
Periods of financial stringency and
crisis and panic (in the United States) occurred in the autumn when western
banks drew large sums of money from the East to pay for shipments of cereals. Credit
demand peaked in the autumn when the grain dealers needed money to pay the
farmers. Sprague noted that the crisis of 1873 came in September because of the
early harvest, that the outbreak of a crisis invariably came as a surprise to
the business community and that the crisis of 1873 was not an exception. The
seasonal tightness of money was well known and hence the puzzle is why it would
have come as a surprise. The ‘excessive tightness’ of money from September 1872
to May 1873 caused the railroads to borrow short-term funds rather than issue
bonds, which could have been seen as a sign of distress, and then the seasonal
tightness precipitated the crash
Distress may be continuous or it
may oscillate in its own rhythm. The crash of the Union Generale in January
1882 was preceded by three separate tense periods, in July, October, and
December 1881. The panic of October 1907 was anticipated (although Sprague
indicated its exact timing was not foreseeable) and preceded by a ‘rich man’s
panic’ in March when Union Pacific stock, the security most widely used as
collateral for finance bill operations, dropped 50 points. Markets recovered
from this blow and from the failure of an offering of New York City bonds in
June (only $2 million was tendered for an offering of $29 million of 4 percent
bonds) and from the collapse of the copper market in July, and from the $29 million
fine levied against the Standard Oil Company for antitrust law violations in
August—only to succumb to the failure of the Knickerbocker Trust Company in
October. In 1929 distress lasted from June to the last week in October (Manias, Panics, andCrashes, p101-102)
Okay, so in old-timey times financial collapses were dictated by the agricultural liquidity cycle, even as the economy increasing industrialized. What does that have to do with 2025? The last great agricultural business cycle was the Great Depression, and by the time that mess was all cleared up in 1946 agriculture was reduced to only about 10% of GDP. Agriculture continued to shrink in importance to the US economy to today when it makes up only about 2% of GDP. Surely this does not generate enough liquidity pressure on the banking system to generate this seasonal pattern. That is true, but let me remind you of how the first tech bubble popped:
 |
The Nasdaq reached its peak on March 9th 2000, then
had a sharp sell off. It was flat but volatile through the summer and
reached a local peak on Sept 1st. The subsequent collapse was much more
gradual than I remember. The Nasdaq did not hit a nadir until October 7
2002. Here we see a very similar pattern of stock market collapse to that
described in 1907 and 1929.
Those of you following until now and are anticipating that I'm going
to turn to 2008 are probably thinking of the bankruptcy of Bear Steans as
the March shock and the bankruptcy of Lehman Brothers as the October
shock. Yeah, that's what I think, too. But the 2008 financial
crisis is different in some ways that should be pointed out. Unlike the
other collapses above, which are mostly stock market crashes (plus a bank panic
in 1907), this was a crisis in mortgage markets. Stocks don't behave in the
March/October pattern as clearly. A graph of the S&P 500 (picked because in
includes Lehman Brothers stock) is mostly a line straight down starting in
October of 2007, which is the right month but not the right year, with a slight
bump up in spring 2008.
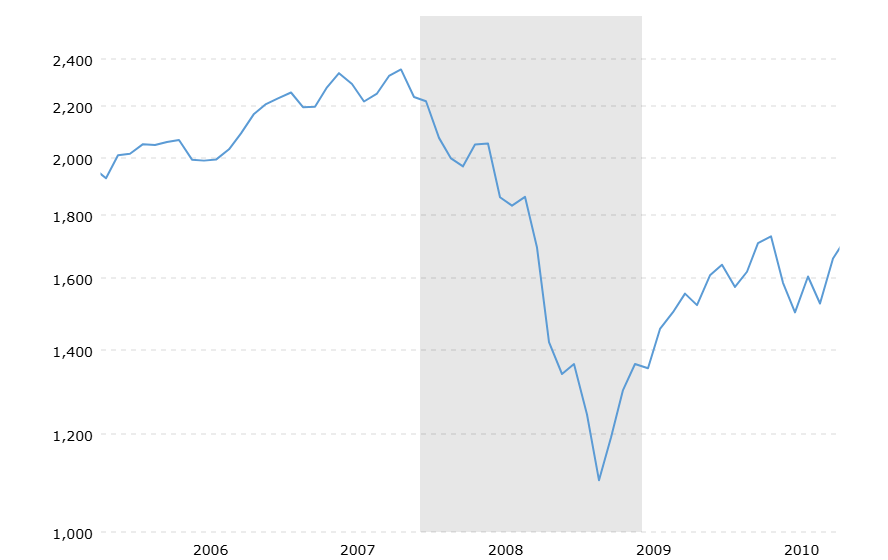 |
| S&P 500 2006-2010 |
But the stock market was responding to business conditions. The recession is officially dated from December 2007 and this adds too much noise to the stock market collapse to divine what is driving it in any detail. Anyway, a collapse that had been in motion since the start of the year got notably more rapid in the fall of 2008. So, this is very different from a stock market perspective. However, the collapse of Bear Sterns in particular helps underscore the idea that "You can remain insolvent a lot longer than you can remain illiquid." That, I think, is the core of these March/October dynamics in other financial crisis.
The two overleveraged subsidiaries that eventually brought
Bear Stearns down declared bankruptcy in June of 2007. Bear Stearns was sued
that summer for misleading investors and in November the writing down of
securities would result in historically rare losses and the firms credit rating
was downgraded. But still, Bear Stearns was able to postpone the
reckoning until early March 2008, when suddenly investors rapidly withdrew
money in a classic bank run by institutional investors.
The figure below shows the seasonal response of Lehman Brothers to
the Bear Stearns collapse. Here we see a big warning: a spike in CDS spreads with a
sharp sell off of stocks in spring. This warning blip is followed by a more gradual, slow motion
collapse trhough the summer. It looks to me like the government intervention to push an orderly sale of Bear Stearns to JP Morgan Chase gave Lehman Brothers breathing room. Not pictured is the catastrophic collapse in September
2008.
Here, I quote liberally from Wiggins,
Pointek and Metrick, 2019:
 |
After the demise of Bear Stearns,
Lehman began casting around for a long-term strategy that would secure the
firm’s future and allay the market’s fears. It considered several options,
including increasing equity, spinning off “toxic” assets (generally real-estate-related
assets) into a separate publicly held corporation, and discussing a sale of the
firm, or a capital infusion, with the Korea Development Bank. Lehman was
successful in raising $6 billion in equity in June 2008, despite a reported
second quarter loss of $2.8 billion, its first since it went public, which was
caused in part by a $3.7 billion write-down on its portfolio of
mortgage-related assets and leveraged loans. But this was not enough to quell
the rumors.
A solution failed to materialize,
and on September 10, 2008, Lehman announced that it expected $5.6 billion
dollars in write-downs on its toxic assets and an expected loss of $3.93
billion for its third quarter. It also announced that it planned to spin off
$50 billion of its toxic assets into a publicly traded corporation in order to
separate them from the remaining “healthy” firm.
The news did not have the positive
effect that Lehman desired. The rating agency Moody’s Investors Service
announced that it planned to lower Lehman’s debt ratings if a “strategic
transaction with a strong financial partner” did not occur soon. Even though
Lehman continued to desperately seek such a partner, with the intercession of
the U.S. Treasury and other government agencies as described below in Regulator
Nonaction, ultimately it failed to secure a firm commitment within the next
week. As a result, it was unable to fund its operations for opening on
September 15, compelling it to file for Chapter 11 bankruptcy protection. (See
Lehman Brothers press release dated September 10, 2008 and Lehman Brothers
press release dated September 15, 2008.) (Wiggins,
Pointek and Metrick, 2019)
Now, shoehorning 2008 into my seasonal theory makes it clear
that I can’t offer a causal mechanism for why this seasonality continues to
happen. Finance bros come home from the Hamptons in September? The 2008 example highlights the seasonality of financial reporting. Maybe
policy interventions follow this seasonal pattern by coincidence? IDK. The
soothsayer didn't need to know it would be 60 senators with knives to issue her
warning to Caesar. Though, in all fairness, less poetry and more
specificity probably would have been more convincing.
Now, I feel pretty confident about my prediction. But, maybe I am a year or two ahead of myself. However, let’s assess the state
of the country’s economy. The rats are eating at the federal government's
COBOL code. There is also a growing chorus of voices who point out it is
impossible for AI to supply the expected return on investment. As if to
confirm these voices AI
ads featured prominently in this years Super Bowl.
As well, as a rough estimate, post-WWII recessions occur
within 12-18 months of when the Fed tightens the hardest. That is, when
the Fed Funds reaches it peak. The Fed Funds rate reached 5.25% in July
of 2023. To the extent similar pressures from the cycle of debt refinance and
the drying up of liquidity exists as they have, we are overdue for downward
pressure on stock prices. Liquidity will
dry up and earnings will be disappointing. Spring 2025 is likely time for
the pressure to start popping out the weaker rivets of our boiler of a
financial system. The financial system will hiss and bulge through the
summer with the catastrophic failure and spectacular explosion coming in the
fall.
The economic dynamics after the stock market crash, I think,
are much harder to soothsay thanks to the liminality of the structural shift that
powers a Cool Zone. I think a financial crash will be inevitable, but how
effectively policy makers handle this crash remains a big unknown. Will the
2025 collapse look more like 2001, which was associated with a mild real economy recession? Or will it be the
catastrophe of 2008?
This unknown is mostly about how the Fed and federal
government with respond. I think no matter what this impending economic crises will be
used to continue the redistribution of American wealth upwards. The open question for the federal government
will be what policy mix emerges. There will
be push and pull between the Hooverite wing of the Republican Party and Trump
who gleefully and proudly sent signed checks to almost all Americans during
Covid. Even then, to the extent that
there is competent counter-cyclical policy it will likely be to keep Americans
in their treats enough so they don't notice the slowly boiling water around
them.
How this crisis plays out for the Fed is also, I think, very
up in the air. The Bernake playbook for dealing with crises has proven a
remarkable success in 2008 and during Covid. Its main success, though,
was in insulating the wealthy from the consequences of their speculative
activity. Not only were the wealthy protected but they are thriving. The
share of the top 1% is about 2 percentage points higher that it was in 2007 on
its way back up to 1929 levels.
Will the Bernanke playbook be enough to maintain the
stability of the system in a way that permanently entrenches modern neoliberalism?
Or, will the zero lower bound go the way of the gold standard? The
economic historian Peter
Temin described the inability of policy makers to see past the
"gold standard orthodoxy" as the root cause of the severity of the
Depression. As also with the chronic inflation at the end of the New Deal
Order, will the neoliberal policy regime simply not be able to imagine the
solutions to the crisis it finds itself in? I think this is very likely and the impending crisis will drag on and
worsen until the political system catches up to provide a solution.
But that's all a conversation to have later. See you when I
blast social media with this post in the fall.


