by Mike on June 12, 2009
Yesterday we went through the Fed’s Stress Test documents and created a toy model to see projected losses under some U3 numbers. I want to talk about a few observations from both the model and the Fed data itself.
A New Fed Stress Test
Elizabeth Warren is calling for a new round of stress tests. This seems like a political non-starter. Can our model make it more appealing?
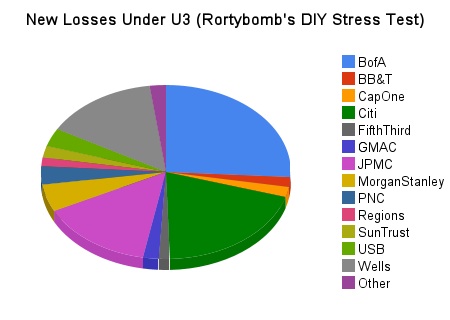
Let’s say that U3 goes to 12.2% in the DIY Stress Test Model. The Financial Sector, which needed to raise $76bn under the adverse scenario, now needs to raise an additional $272bn. How is that distributed? Here’s a graph (Updated, and fixed):

Four firms – BoA, Citi, JP Morgan Chase and Wells Fargo – account for 75% of the new losses. Morgan Stanley is 5%. Everything else is less than 4%, with some still at zero.
I believe we should have another official Stress Test of the largest 5-8 firms at the end of the summer. There is no reason to drag in all the firms all over again. To whatever extent American Express and other small players had unknowns going into the crisis we have a handle that their capital reserves can take a shock and if they need to raise $1-$3bn the market should be able to handle it. If BoA needs another $75bn, that will have to come from the government.
We still have a lot of uncertainty with the largest 5 firms, and since we, regardless of how they are paying their TARP, have a liability in them we should demand accountability. In an additional 3 months it will be much clearer what both the books and the economic outlook will be. As a bonus we’ll have them already committed to a set of models and techniques. To whatever extent they could cherry-pick their data and their models the first time around, we can force them to stay consistent the second time around and extrapolate confidence intervals from there.
A “5 firm Stress Test Checkup” will also be as an easier sell. Instead of dragging what felt like the entire financial sector in front of the jury we look at the specific firms we know have a problem. That strikes me as fair and appropriate and also more politically reasonable.
What about Size versus Losses?
There was a bit of a blogosphere debate a few months ago about the optimal size of a bank. There was an argument from the big-is-better crowd that larger banks may have more losses net, but as a percent of total assets it will be smaller. A bank that is size $100 might lose $10 for a 10% loss, and a size $50 bank might lose $7 for a 14% loss. So even though the big banks were losing more total dollars – $10 versus $7 – they were probably doing better as a percent than the smaller banks – 10% versus 14% – because they were more ‘innovative.’
The argument was that larger banks would have smaller expected losses overall as a percent (or, alternatively, that smaller banks would have a larger expected loss percent) because there was some sort of return to risk management with size. Larger banks can hire the smartest MBAs with giant salaries to have them ‘innovate’ risk-management techniques that your local bank can’t afford. Your local bank can’t lend to CRE developments in Japan while handling credit cards in Hong Kong while also giving out subprime mortgages in the LA suburbs. Your Giant Bank can. By having access to more lines of business they would be able to diversify their lending in a way that takes advantage risk management techniques not available to smaller banks.
How’d that work out? I want to show you a really interesting chart. Let’s look at risk weighted-assets plotted against total losses for all the firms (kicking out American Express as a non-appropriate outlier). From the Fed’s SCAP Document, specifically the summary chart I put here, so no toy model:

This chart should feel like someone just kicked you in the stomach. The biggest banks, using their own models they chose to report to the Fed, did terrible compared to a basket of small banks.
At a base level, in a crisis all correlations go to 1. So whatever diversification benefits the largest banks had by being able to hold on to all asset types is out the window. To whatever extent their being big allowed them to have larger and smarter capital buffers, that is gone as well. Instead of being lower, or even random or having no pattern, it is clear that the bigger banks do worse with handling losses and risk than small banks do even as a percentage.
I really want to see this replicated large scale in a more controlled fashion, but intuitively this makes sense to me. The bigger you are the more internal noise there is in your corporation. It is easier to make a clever 10% return with $100m than with $1bn; alpha does not scale well, and the bigger you are the more competition is watching you. The obvious thing to do to get larger profits than your smaller competition is to keep a smaller capital buffer. There is a separate argument that bigger banks can handle larger losses better; beyond having a kind of financial nihilism to it, it has turned out to be completely untrue. So here we are. Looking at the data for a while, being big is a big liability. For those banks. But mostly for you, me and everybody else.
No comments:
Post a Comment